
prometheus+consul服务发现
常见几种服务发现模式
静态服务发现:
1 | - job_name: 'test' |
文件服务发现:
周期性自动检查特定文件内容读取加载到配置,不需要重启
1 | - job_name: 'file_sd_test' |
yml格式:
1 | - targets: ['10.1.74.109:9100'] |
consul:
面向分布式,提供服务注册、服务发现和配置管理。
通过exporter注册到consul服务,然后将数据汇聚到prometheus进行收集,exporter–>prometheus–>grafana,注册简单,批量监控
docker方式运行:http://$ip:8500访问正常即可
1 | version: "3.5" |
安装测试3节点,以下使用ansible同步操作步骤,运行exporter:
1 | [root@k8s-master ~]# ansible all -m ping -o |
注册consul:
1 | [root@k8s-master ~]# cat consul.sh |

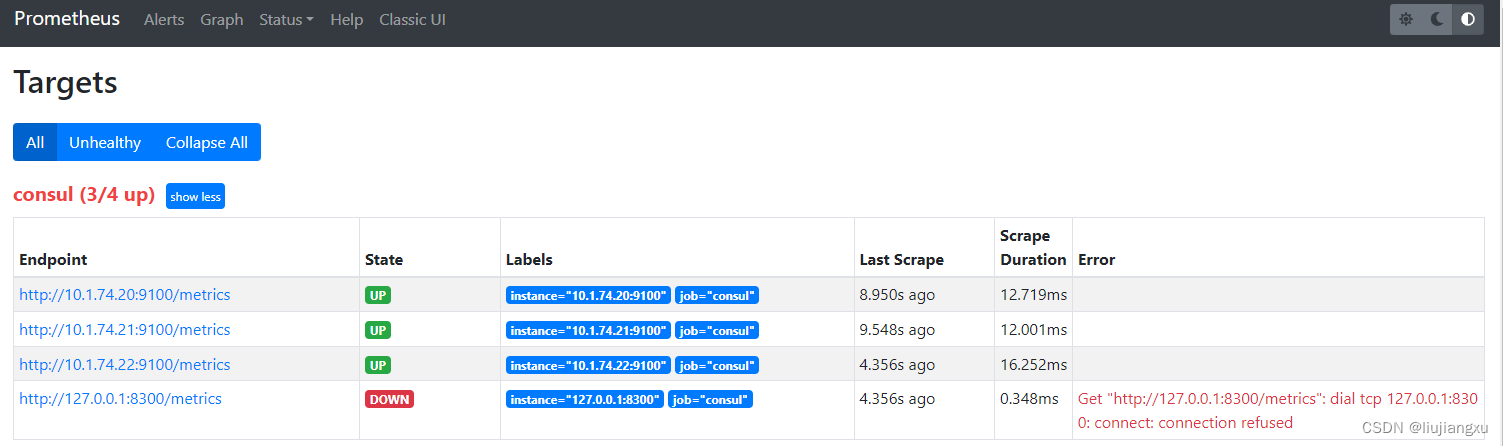
配置prometheus
增加consul配置项完成后重启prometheus,查看已自动发现
1 | [root@ prometheus]# vi prometheus.yml |
删除服务
1 | [root@ prometheus]# curl -X PUT http://{cousul_ip}:8500/v1/agent/service/deregister/{ID号} |
本博客所有文章除特别声明外,均采用 CC BY-NC-SA 4.0 许可协议。转载请注明来源 liujxu!
 wechat

相关推荐

2025-12-08
prometheus+cadvisor监控docker
官方解释 cAdvisor(ContainerAdvisor)为容器用户提供了对其运行容器的资源使用和性能特性的了解。它是一个正在运行的守护程序,用于收集、聚合、处理和导出有关正在运行的容器的信息。具体来说,它为每个容器保存资源隔离参数、历史资源使用情况、完整历史资源使用的直方图和网络统计信息。该数据按容器和机器范围导出。 说白了其实和一般监控的agent类似,就是将容器内部的监控指标持久化存储然后web ui界面展示,结合prometheus+grafana更好的汇聚监控指标 docker部署12345678910111213141516[root@zabbix cadvisor]# cat docker-cadvisor.yml version: "3.5"services: cadvisor: image: harbor.od.com/prometheus/cadvisor:latest container_name: cadvisor volumes: - /:/rootfs:ro - /var/run:/va...

2025-12-08
prometheus-metrics指标翻译
cadvisor1234567891011121314151617181920212223242526272829303132333435363738394041424344454647484950515253cadvisor_version_info: cAdvisor 版本信息container_cpu_cfs_periods_total: CFS (Completely Fair Scheduler) 周期总数container_cpu_cfs_throttled_periods_total: 受 CFS throttling 的周期总数container_cpu_cfs_throttled_seconds_total: 受 CFS throttling 的秒数总数container_cpu_load_average_10s: 容器 CPU 的 10 秒平均负载container_cpu_system_seconds_total: CPU 在系统模式下的使用总时间container_cpu_usage_seconds_total: CPU 的总使用时间container_c...

2025-12-08
prometheus-promQL语法
运算 Value + 加法 - 减法 * 乘法 / 除法 % 求余 ^ 幂运算 == 相等 !== 不相等 > 大于 < 小于 >== 大于等于 <== 小于等于 and 并且 or 或者 unless 排除 12以MB方式获取当前主机空闲内存空间node_memory_free_bytes_total / (1024 * 1024) 12磁盘读+写计算磁盘io的byte数值node_disk_written_bytes_total + node_disk_read_bytes_total 12计算空闲内存百分比(总-空闲 / 总)(node_memory_MemTotal_bytes - node_memory_MemFree_bytes) / node_memory_MemTotal_bytes 12计算空闲内存百分比并大于0.95(node_memory_MemTotal_bytes...
2025-12-08
prometheus处理pprof漏洞
以下步骤为构建docker镜像步骤 所需个人镜像仓库(使用阿里云镜像) 大部分操作为gitpod操作,可避免国内依赖安装失败 本地依赖安装安装环境123456yum install -y git yum install -y wget yum install -y go # 版本在1.17及以上yum install -y npm # 版本在7及以上yum install -y nodejs # 版本在16及以上 官网安装地址:https://nodejs.org/zh-cn/download/package-manageryum install -y bzip2 开启\关闭模块支持12341、开启模块支持: export GO111MODULE=on # 执行2、关闭模块支持: export GO111MODULE=off 国内代理1234561、七牛 CDN go env -w GOPROXY=https://goproxy.cn,direct2、阿里云 go env -w GOPROXY=https...

2025-12-26
Dockerfile构建安装zabbix
docker-commpose传送门: zbx_server || zbx_web || zbx_mysq || zbx_gateway. 使用特权模式启动一个centos容器1234567891011121314151617FROM centos:centos7.9.2009WORKDIR /root/RUN rm -f /etc/yum.repos.d/*ADD ./CentOS-Base.repo /etc/yum.repos.d/ADD ./sql /root/ADD ./simkai.ttf /root/RUN yum clean all \ && yum makecache \ && yum install wget less curl gcc gcc-c++ vim kde-l10n-Chinese net-tools -yRUN yum reinstall glibc-common -yRUN echo " LANG=zh_CN.UTF-8" > /etc/locale.conf &...

2025-12-26
zabbix6.4自带模板监控mysql
6.4添加自带的mysql模板报错,显示不支持12Preprocessing failed for: Cannot fetch data: Error 1045: Access denied for user 'root'@'172.20.0.1' (using password: NO).1. Failed: cannot extract value from json by path "$.Aborted_connects": cannot convert value to string 创建用于监视的 MySQL 用户12CREATE USER 'zbx_monitor'@'%' IDENTIFIED BY '<password>';GRANT REPLICATION CLIENT,PROCESS,SHOW DATABASES,SHOW VIEW ON *.* TO 'zbx_monitor'@'%'...